
Case studyHome decor and lightingApril to September 2025
 Real account, real captures
Casa & Beyond: A$338K to A$672K a month across 5 markets
How an Australian homewares and lighting brand doubled its home market and grew its US account 6.9x in five months, without letting CAC run away
- Peak AU month
- A$672K2.0x
- Best month ROAS
- 2.69x
- US account
- $47K to $324K6.9x
- Live markets
- 5
Tracked revenue by month
Australia from April and the United States from May 2025, from Ad-Lab's internal reporting and the client channel on the dates shown.
| Period | Value |
|---|---|
| Apr | A$338K |
| May | A$442K |
| Jun | A$560.6K |
| Jul | A$623K (to 31 Jul) |
| Aug | A$672K (to 28 Aug) |
| Sep | A$563.8K |
| Period | Value |
|---|---|
| May | $47.3K |
| Jun | $93K |
| Jul | $160K (to 31 Jul) |
| Aug | $190K (to 28 Aug) |
| Sep | $324K |
July and August are month-to-date on the reporting date (31 July and 28 August), so both months closed higher. September is the closing figure. Australia in AUD, United States in USD.
The brand
Australian homewares and lighting, wide catalogue, long consideration cycle.
Casa & Beyond
Australian homewares brand selling lamps, living room decor, bedding, bathroom and kitchen ranges. Wide catalogue, mixed price points, and the long consideration cycle that comes with furniture and lighting. Exactly the shape of account where a blended average hides what is happening underneath.
Home decor is a hard category to bid on. One A$400 floor lamp and one A$29 cushion cover sit in the same feed, carry different margins, and attract different buyers. Most accounts we inherit treat them as one signal. The bidder averages itself into the wrong allocation and the account plateaus.
Casa & Beyond hit that ceiling. Revenue was there, but ROAS moved month to month and nobody could say which SKUs were carrying the account. The brief was to grow without pushing customer acquisition cost past its sustainable ceiling.
The challenge
Where the account sat in April and May 2025, before the rebuild.
The last week of May 2025, before the rebuild
| Market | Tracked revenue, 7 days | ROAS, 7 days |
|---|---|---|
| Australia | A$92.1K | 2.08x |
| United States | $14.2K | 2.15x |
| Germany | $2.4K | 3.17x |
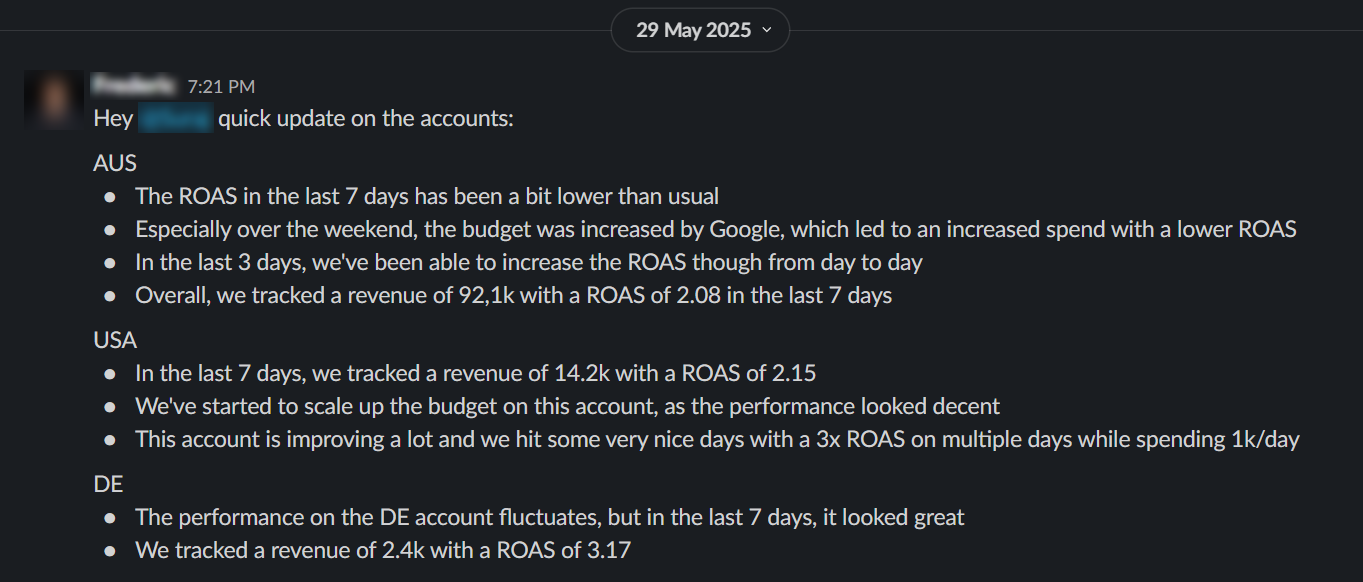
Seven days to 29 May 2025, from the account manager's update that week. The month itself closed at A$442K in Australia, a record, but budget spikes over the weekends were dragging ROAS down and nobody could say which SKUs were carrying it.
What was wrong on day one
- Keyword targeting broad enough that spend leaked into low-intent queries
- Ad groups mixing intent levels, so Smart Bidding learned against an averaged signal
- No SKU prioritisation by margin or conversion volume
- Weekend overspend with no guardrail, visible as ROAS dips in the reporting
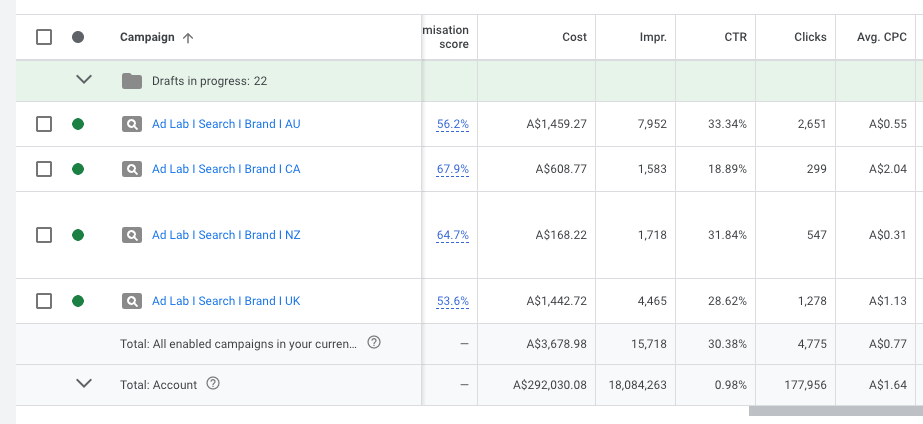
- UK, NZ and CA sitting idle behind Merchant Center reviews
The update the seven-day table comes from
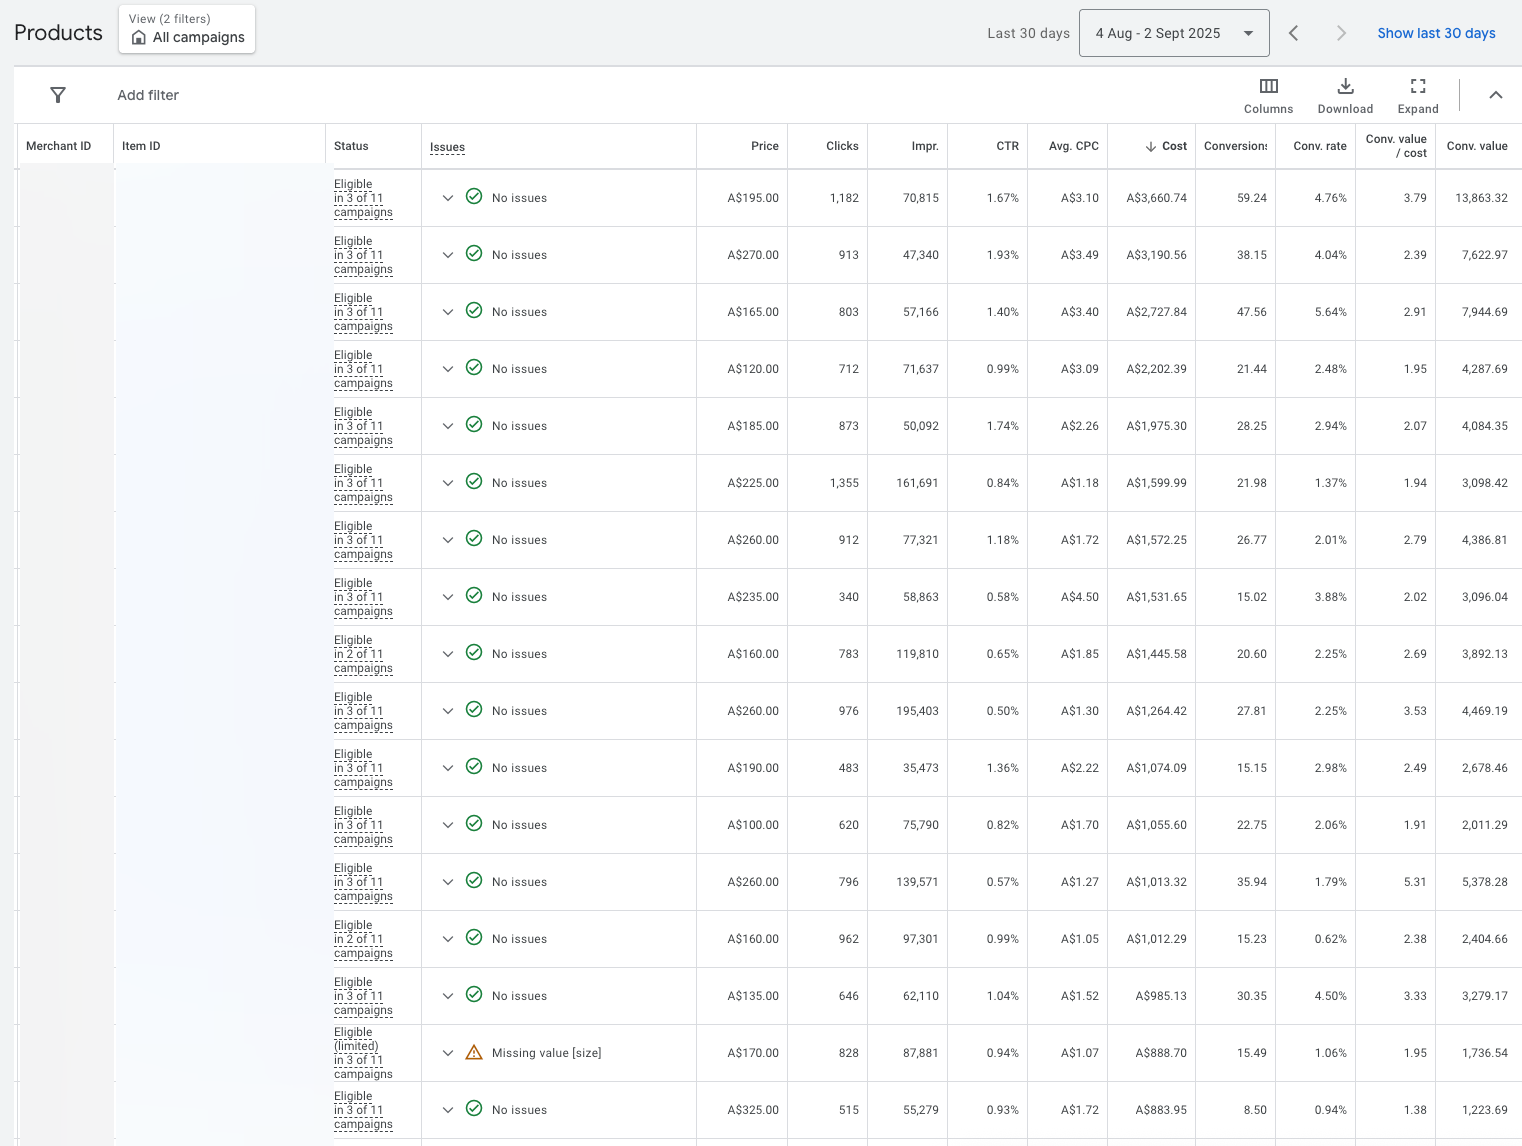
Getting the feeds through Merchant Center
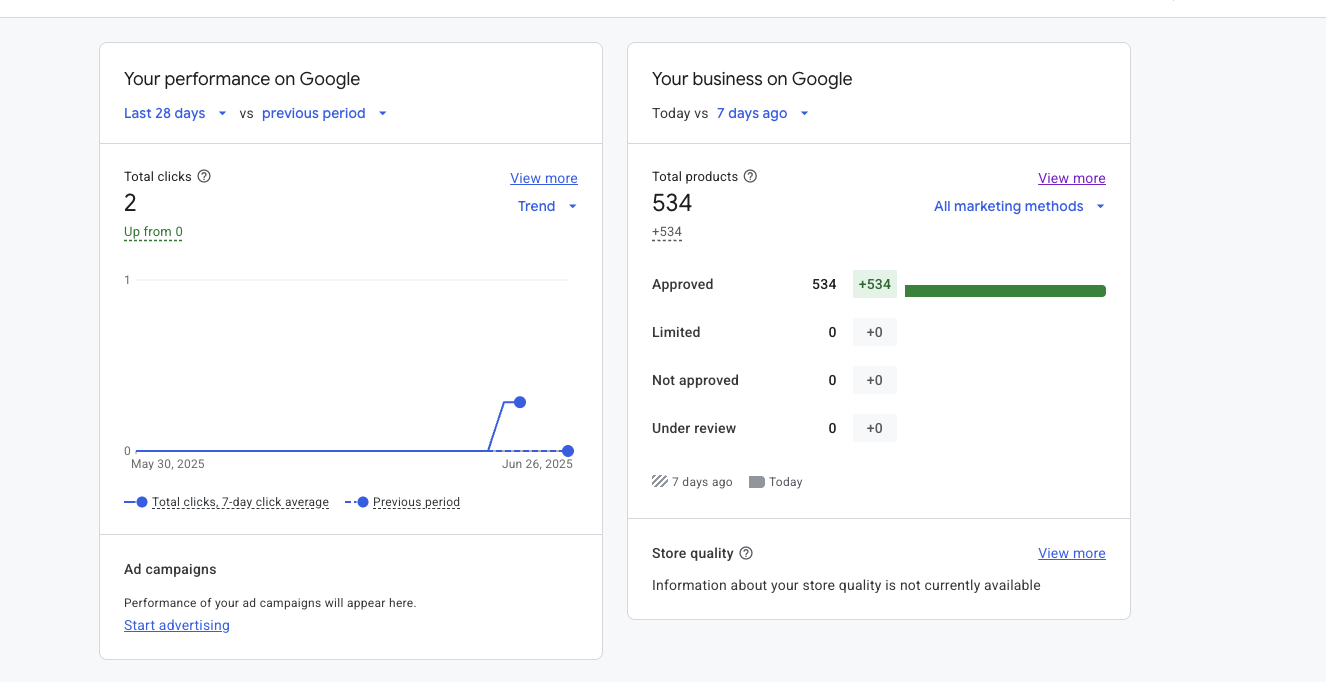
Three markets started the engagement stuck behind Merchant Center. This is what a market feed looks like the week it comes out the other side.
The playbook
Three changes, run in order.
Three coordinated changes
01
Segmented high-AOV SKUs by margin
Grouped products by margin and conversion volume, then funded the tiers that earned it. We scaled the proven winners and cut the underperformers, instead of forcing one tROAS to fit every SKU.
02
Built tight campaign clusters
Each campaign focused on one collection theme paired with one intent level. CTRs went up, and Smart Bidding got a cleaner signal to learn against, because the conversion patterns inside each cluster shared a buyer profile.
03
Optimised ROAS at the SKU level
Every decision ran off two numbers per SKU: conversion value over cost, and margin per unit. Account-level averages mislead at this scale, so we never made a budget call off one.
Account architecture, before and after
Inherited structure
- Broad campaigns covering whole categories
- Mixed intent inside single ad groups
- One tROAS applied across every SKU
- Brand and non-brand blended into one reported number
- Australia carrying the account, the US and Germany a rounding error
Rebuilt structure
- Campaign clusters at one theme and one intent level each
- Margin tiers with their own budgets and targets
- Brand split out so non-brand performance is visible
- PMax added for products the feed was underexposing
- 5 markets live, each with its own feed and reporting
Nothing about the brand or the catalogue changed between April and August. The account architecture did.
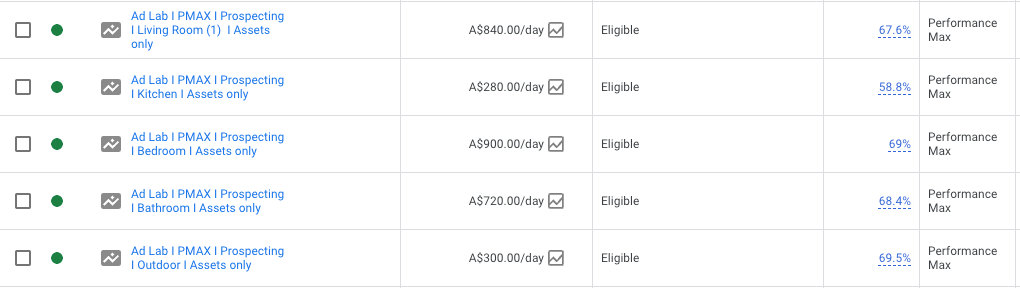
The structure, straight out of the account
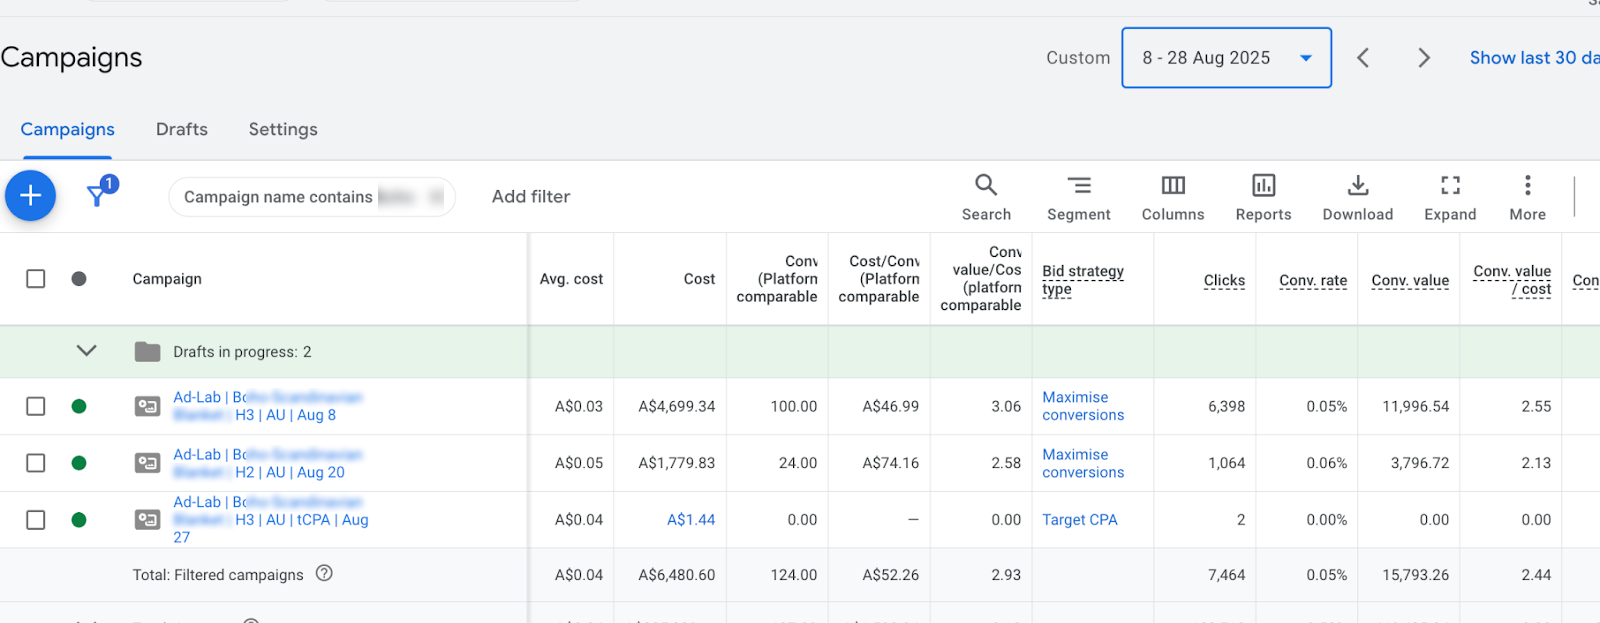
Four views of the build. Client name, store URL, product names and account IDs are softened. Every figure is untouched.
Month by month
What happened, month by month, from the internal reporting.
The scaling arc
Every figure below comes from Ad-Lab's internal account reporting on the date shown.
April 2025
Where it started
- AU revenue
- A$338K
- AU daily spend
- A$4K to A$5K
- AU ROAS, 7 days
- 2.67x
The first month with a closing figure on record. Australia was spending A$4K to A$5K a day at a seven-day ROAS of 2.67 in mid-April, then gave some of it back over Easter. The US and Germany were live but small.
May 2025
A record, with a wobble at the end
- AU revenue
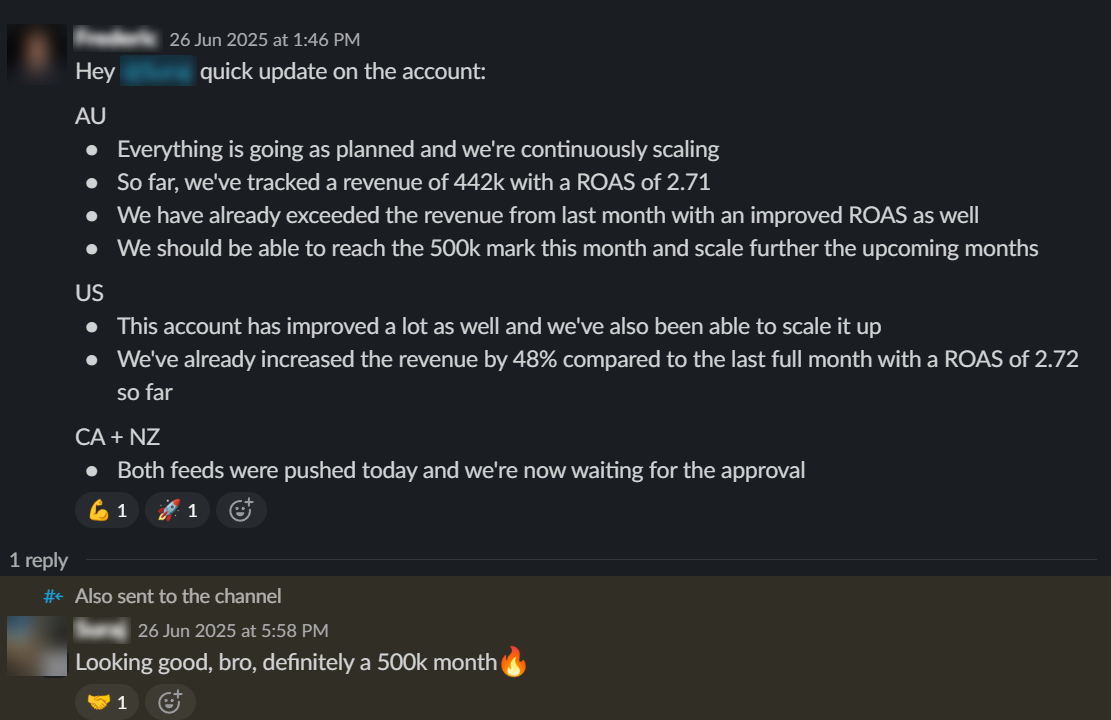
- A$442K
- AU ROAS
- 2.48x
- US revenue
- $47.3K
- US ROAS
- 2.66x
Australia closed at A$442K, nearly A$100K over April, and the US grew 166% on April to $47.3K. The last week is the one that shaped the rebuild: Google lifted budgets over the weekend, spend ran ahead of demand and the seven-day ROAS dropped to 2.08. The US managed 2.15 that week with several 3x days, which told us the demand was there and the structure was not.
June 2025
The breakout month
- AU revenue
- A$560,646
- AU spend
- A$208K
- ROAS
- 269.55%
- Conversions
- 3,920
Australia went from A$442K in May to A$560,646 in June at the highest ROAS of the whole engagement. The US hit its own record at $93K and 2.64. Daily spend moved to roughly A$10K in Australia and $2K in the US. Canada went live. New Zealand was still stuck in Merchant Center review.
July 2025
Second record month running
- AU revenue
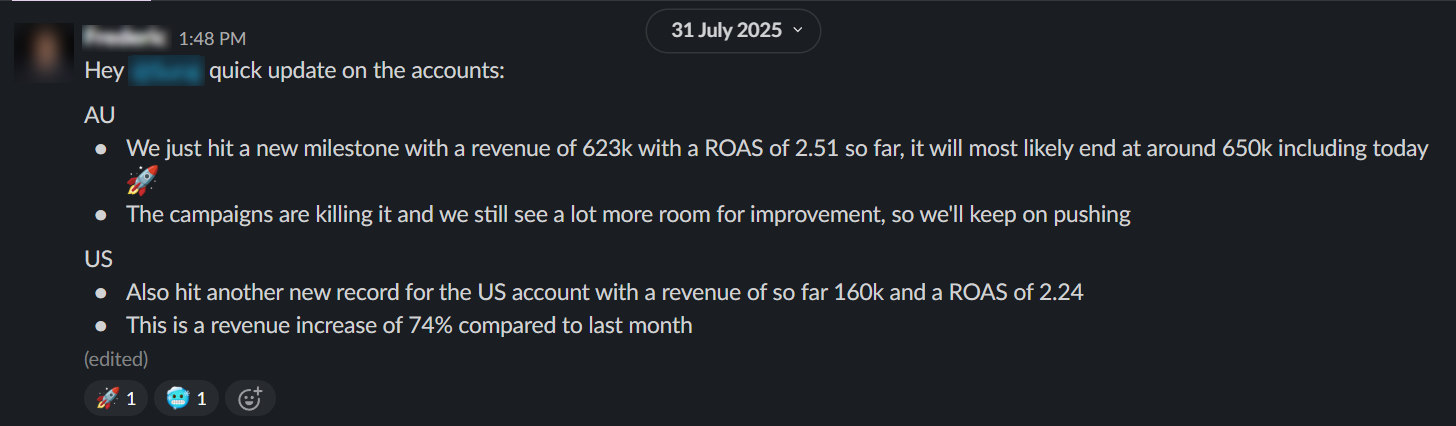
- A$623K
- AU ROAS
- 2.51x
- US revenue
- $160K
- US growth
- +74%
Australia cleared A$623K by 31 July at 2.51 and closed near A$650K. The US put on 74% in a month, from $93K to $160K at 2.24. Spend held around A$10K a day while both markets grew, which is the part that matters: the structure absorbed more budget without giving back efficiency.
August 2025
Record month in both markets
- AU revenue
- A$672K
- AU ROAS
- 2.52x
- US revenue
- $190K
- NZ ROAS
- 2.03x
Tracked to 28 August and pacing at roughly A$750K. Australia and the US set records in the same month. New Zealand came out of Merchant Center and started picking up at 2.03. YouTube was scaling hard by this point.
September 2025
The US takes over
- AU revenue
- A$563.8K
- AU ROAS
- 2.1x
- US revenue
- $324K
- US ROAS
- 2.09x
The US closed its best month ever on the account, up from $47.3K in May. Australia closed at A$563.8K on A$269.91K of spend, off the August peak by design as the engagement wound down. US daily spend sat between $4.5K and $6K on days that cleared 3x.
July and August figures are month-to-date on the reporting date shown, so those closing totals ran higher. September is the closing figure. Australian figures are in AUD.
6.9x
US account, May to September 2025
$47.3K a month to $324K a month on the same catalogue and the same playbook
The YouTube call
The part most agencies get wrong, and the number that proves it.
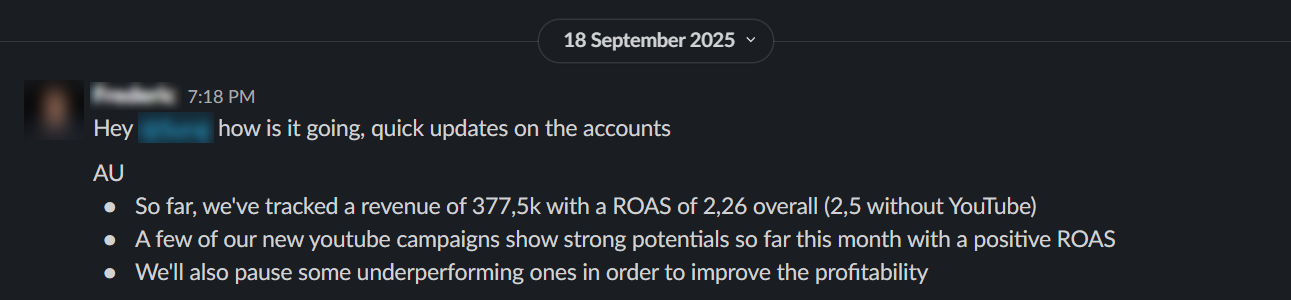
Once YouTube was running at volume we reported Australia two ways: blended, and with YouTube stripped out. In late September the account read 2.25 blended and 2.55 without YouTube. Earlier that month it was 2.22 and 2.48. Mid-month it was 2.18 and 2.40.
That gap is the honest cost of buying cold traffic, and it is the number most agencies hide. YouTube pulls blended ROAS down while it grows the top of the funnel. The job is to keep that gap inside a band you have agreed with the client, prune the campaigns sitting outside it, and let the rest compound.
Underneath the blend, the individual YouTube campaigns in September ran at 2.2, 1.77 and 1.57. Only the first of those carries its own weight on a last-click view, and that is the point: you fund the 2.2, you keep the 1.77 while it feeds the rest of the account, and you cut the 1.57. That decision is impossible to make if the only number you look at is the blended one.
Australia, blended against non-YouTube
| Reported | Window | Blended ROAS | Excluding YouTube | Gap |
|---|---|---|---|---|
| 4 Sep 2025 | Last 7 days | 2.22x | 2.48x | 0.26 |
| 11 Sep 2025 | Month to date | 2.18x | 2.40x | 0.22 |
| 19 Sep 2025 | Month to date | 2.26x | 2.50x | 0.24 |
| 25 Sep 2025 | Month to date | 2.25x | 2.55x | 0.30 |
A stable gap of roughly 0.25 is a healthy cold traffic tax. When it widened we pruned the weakest YouTube campaigns rather than cutting the channel.
How it was reported to the client
Both numbers in the same message, which is the whole point of this chapter.
Inside one week
A single week of Australian reporting, exactly as it came out of the account.
Week ending 21 July 2025, Australia
| Metric | Value | Week on week |
|---|---|---|
| Revenue | A$89,846.50 | -31.28% |
| Ad spend | A$39,777.24 | -29.62% |
| ROAS | 2.26x | -2.36% |
| CPA | A$60.84 | +3.33% |
| Conversions | 653.77 | -31.89% |
A deliberate pull-back week. Spend came down 29.62% and ROAS held within 2.36%, which is the point of margin-tiered structure. You can take your foot off without the account falling over.
We are including a down week on purpose. Every case study on the internet shows the best week. The useful question is what happens when you cut spend by 30% in an account this size, and the answer here is that ROAS moved 2.36% and CPA moved 3.33%. Nothing broke.
Top campaigns that week were brand search at 26.31x in Australia on A$250.84 of spend and 86.15x in New Zealand on A$19.18. Those are real numbers, and they are also the reason we never report a blended figure without splitting brand out first.
The results
Six months, 5 markets.
Straight out of the account
The Australian account in its final full month with us, pulled from the live Google Ads reporting dashboard the client saw every week.
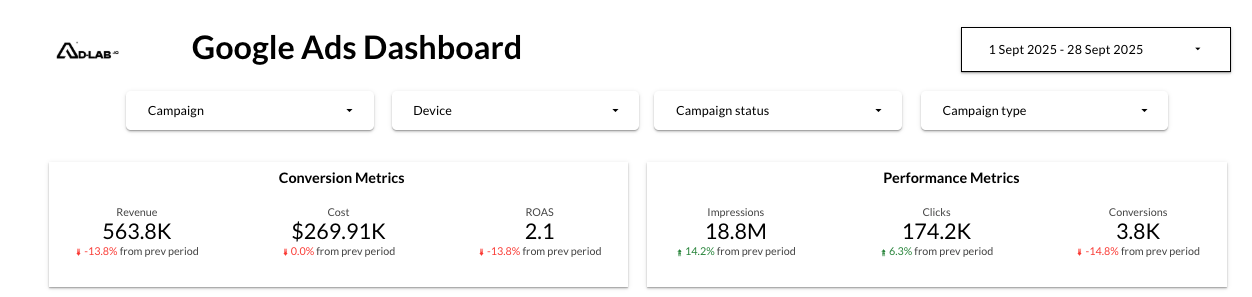
Client name, store URL and product names do not appear in Ad-Lab reporting dashboards, so nothing here needed redacting.
Start against peak
| Market | Start | Peak month | Multiple |
|---|---|---|---|
| Australia | A$338K (Apr) | A$672K (Aug) | 2.0x |
| United States | $47.3K (May) | $324K (Sep) | 6.9x |
| New Zealand | Not live | Live at 2.03x ROAS | New market |
| Canada | Not live | Live and gathering data | New market |
| Germany | $10.9K (May) | Small market, held between 2x and 3x | Held |
August is month-to-date on 28 August, so the closing total ran higher. Australian figures in AUD.
June 2025, the single best month
| Metric | Value |
|---|---|
| Tracked revenue | A$560,646.22 |
| Ad spend | A$208,000 |
| Conversions | 3,920 |
| ROAS | 269.55% |
| Daily spend by early July | A$10,000 |
Same brand, same product catalogue, same CAC budget. Different account architecture.
The month it crossed A$500K, in the client's words
Three captures from the client channel as June closed and July opened, then the update a month later. Names and faces are softened; nothing else is touched.

Frameworks behind this case study
Where these numbers come from
Patrick first wrote this account up on the newsletter on 28 July 2025, the week the numbers landed. The figures on this page come from dated internal reporting and the client channel, and the account captures are shown as exported. The only edits are to client-identifying details, which are softened, and transcripts replace people's names with company names.
Read the original write-upWant this structure on your account?
Free 30-minute audit. No deck. No pitch.
We screenshare your Google Ads, GA4 and Shopify, run the same audit playbook this account came out of, and leave you the document whether you become a client or not.
Book the call